WSL Solar Co., Ltd.
In 2018, major markets in Asia such as Taiwan and Malaysia have grown, while other markets such as Thailand, Indonesia, the Philippines, and Vietnam have developed intermittently over the years.
Main Content of the Global PV Market Report
On a similar basis to 2016, the global PV market broke several records in 2017. Photovoltaics continues to expand globally, reaching almost 100 million kilowatts. One might have expected that market behavior in 2018 would be similar. However, preliminary results show that the global market tends to be stable, and the annual installed capacity in 2018 will once again reach about 100 million kilowatts.
In recent years, the development level of China's PV market has greatly promoted the development of the global PV market. However, although the Chinese PV market has been growing until 2017, it experienced a small decline in 2018. However, this decline in the Chinese PV market has not had a major impact on the global PV market. On the contrary, the global PV market has been compensated for the larger installed capacity outside China. In 2018, China's new PV installed capacity is about 45GW, compared with 53 GW in 2017. The global PV market is in a stable state with a new installed capacity of 99.8 GW in 2018 and an increase of 98.9 GW in 2017.
Custom Solar Panel from WSL Solar (https://www.wsl-solar.com)
India ranks second behind China and ranks second in India in 2018. The installed capacity of photovoltaics in India is about 10.8 GW, followed by the US market, with installed capacity shrinking slightly to 10.6 GW. Next is the European Union, with an installed capacity of 8.3 GW for installed capacity and 6.5 GW for Japan, with a slight decline in new installed capacity.
The top five are very similar to 2017 except that the rankings of some countries have changed. In addition, the main development in 2018 is the growth of several other countries after the top five: Australia's installed capacity is 3.8 GW, Mexico is 2.7 GW, and South Korea is 2.0 GW. Turkey followed closely and gained 1.6 GW of installed capacity in the declining market. In-depth study of the EU countries, Germany experienced the best year since 2013, installed capacity of about 3.0 GW, the Netherlands into the top 10, installed capacity of 1.3 GW.
Figure: Top 10 countries with new installed capacity and cumulative installed capacity in the world in 2018
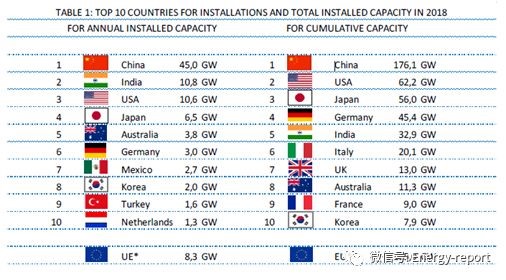
The left is the annual installation; the right is the cumulative installation
Asia continues to dominate the global PV market. In 2018, major markets in Asia such as Taiwan and Malaysia experienced growth, while other markets such as Thailand, Indonesia, the Philippines, and Vietnam developed intermittently over the years. The Asian market has a share of less than 70% in the global PV market, which is down from 2018 compared to 2017.
Asia continues to dominate the global PV market. Some of the major Asian markets that have been established, such as Taiwan or Malaysia, have experienced growth in 2018, while developments in other markets such as Thailand, Indonesia, the Philippines and Vietnam have been intermittent in the past few years. The Asian market accounts for a little less than 70% of the global PV market, and it has declined in 2018 compared to 2017.
In the Americas, the decline in the US market (10.6 GW) was offset by Mexico, and Mexico installed about 2.7 GW in 2018. In Brazil, with a installed capacity of 1.0 GW in 2017, its electricity market has shrunk to less than 400 MW. Chile's installed capacity is 461 MW, down from 657 MW in 2017. Canada experienced a new market downturn in 2018, with the market dropping from 249 MW in 2017 to 100 MW in 2018. In 2018, the Americas accounted for about 15% of the global PV market.
In Europe, Germany has established its leading position in continental Europe and installed nearly 3.0 GW in 2018. The Netherlands has become the main event of this year with 1.3 GW of installed capacity, followed by France, but still below the GW-class installed capacity. Other European countries have experienced interesting developments, but at a lower level: Ukraine (more than 700 MW), Hungary (400 MW) and Belgium (405 MW). Italy (435MW) and Spain (374MW) have seen a slight rebound after years of almost no market. Compared with previous years, the UK has fallen to a very low level (268MW), while the Polish market has grown (214MW). Some medium-sized European markets remain stable, such as Switzerland (260MW) and Austria (153MW). In the Nordic countries, the PV market in Sweden (155MW), Denmark (91MW), Finland (59MW) and Norway (23MW) achieved growth in 2018. The Portuguese market also grew slightly (88MW). Turkey's installed capacity is 1.6 GW, a significant drop from 2017. In 2018, Europe's share of the global PV market was slightly above 9%.
In the Middle East, Israel has added an additional 432 MW of installed capacity, the highest level in years. Morocco has an installed capacity of 591 MW and is currently planning a substantial increase. Several other countries in the region have also experienced rapid growth and hundreds of megawatts of installed capacity, which will be basically connected to the grid by 2019. In the UAE and Egypt alone, we expect more than 2 GW of power plants to be connected to the grid in 2019, and these plants have been partially developed by the end of 2018.
In Africa, South Africa became the first African country with nearly 1 GW of photovoltaic installed capacity in 2014, but since then, the solar market has fallen sharply, with only 60 MW installed in 2018. There have been some surges in projects across the country, but few countries have actually installed a large number of projects in 2018. In 2018, Africa and the Middle East accounted for about 6% of the global PV installed capacity.
Overall, the global PV market has almost reached the 100 million kilowatt mark. If China's market level is similar, then this increase will be much higher than the 2017 installation level. In 2018, China's overseas market grew by more than 17%, compared with 15% in 2017.
In 2018, photovoltaic installation capacity in 10 countries exceeded the GW mark. At present, the total installed capacity of 8 countries exceeds 10GW, 4 countries exceed 40GW, and China alone has 176.1GW. Germany, the country that has been at the top of the list for many years, lost its leading position in 2015 and is now ranked fourth (45.4GW), Japan third (56.0GW) and US second (62.2GW). Europe's current total installed capacity exceeds 120.4GW, far behind the leading level in Asia. The current installed capacity is at least 294.1MW, and there will be more in the next few years.
The key event in 2018 was China's decision to limit its PV market. In order to avoid overheating of the PV market and limit the impact on retail electricity prices, the central government has imposed restrictions on the development of photovoltaics since May 31, 2018. At the end of 2018, the results were not as low as people expected, but the result was the same: driven by concerns about the market downturn, parts prices fell rapidly, especially module prices. The decline in prices has accelerated the deployment at the end of the year to some extent, at least to some extent, to stabilize the market.
WSL Solar has been a professional manufacturer of custom solar panel and solar solution provider in China since 2006.
Add: Building D2, Huigao Science and Technology Innovation Park, No. 46 Chuangxing Road, Gaobu Town, Dongguan City, 523273 China
Phone: +86 769 2332 2355
Email: info@wsl-solar.com